Project Background
The vehicular traffic is increasing tremendously these days, simultaneously congestion also increases. To prevent congestion, one option is to increase the capacity by increasing the number of the existing transportation system. A second option is to develop alternatives that increase capacity by improving the efficiency of the existing transportation system. The latter focuses on building fewer lane miles.
To Overcome these Problems, the New York city Department of transportation (NYCDOT) uses Automated Traffic Recorders (ATR) to collect traffic sample volume counts at brodge crossings and roadways. These counts do not cover the entire year, and the number of days counted per location may vary from year to year.
Data Description
NYC Automated Traffic Count allows the user to view and access traffic data information of different cities in NYC. The information is displayed in the form of excel. New York City transportation uses automated traffic recorders to collect traffic volume counts at bridge crossings and roadways. The data consists of car volume, averaged every 15 mins for the duration of 2000 to 2020. This traffic data can be used to determine various type of analysis and design patterns in traffic over the year 2000 to 2020. The information is collected from Kaggle in a form of 1 3GB excel file and consists of 14 rows and 27190511 columns.

Results
Data visualization Using NYC-Automated-Traffic-Volume-Counts
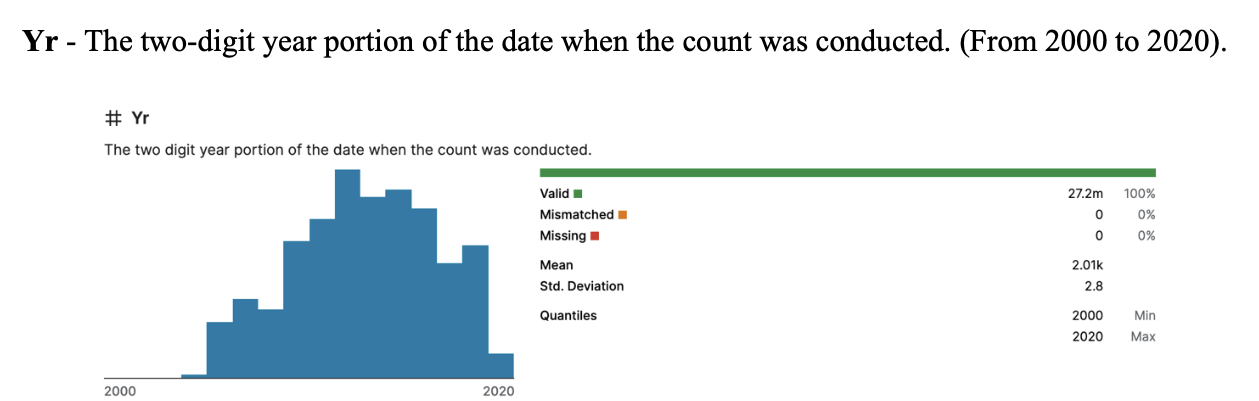
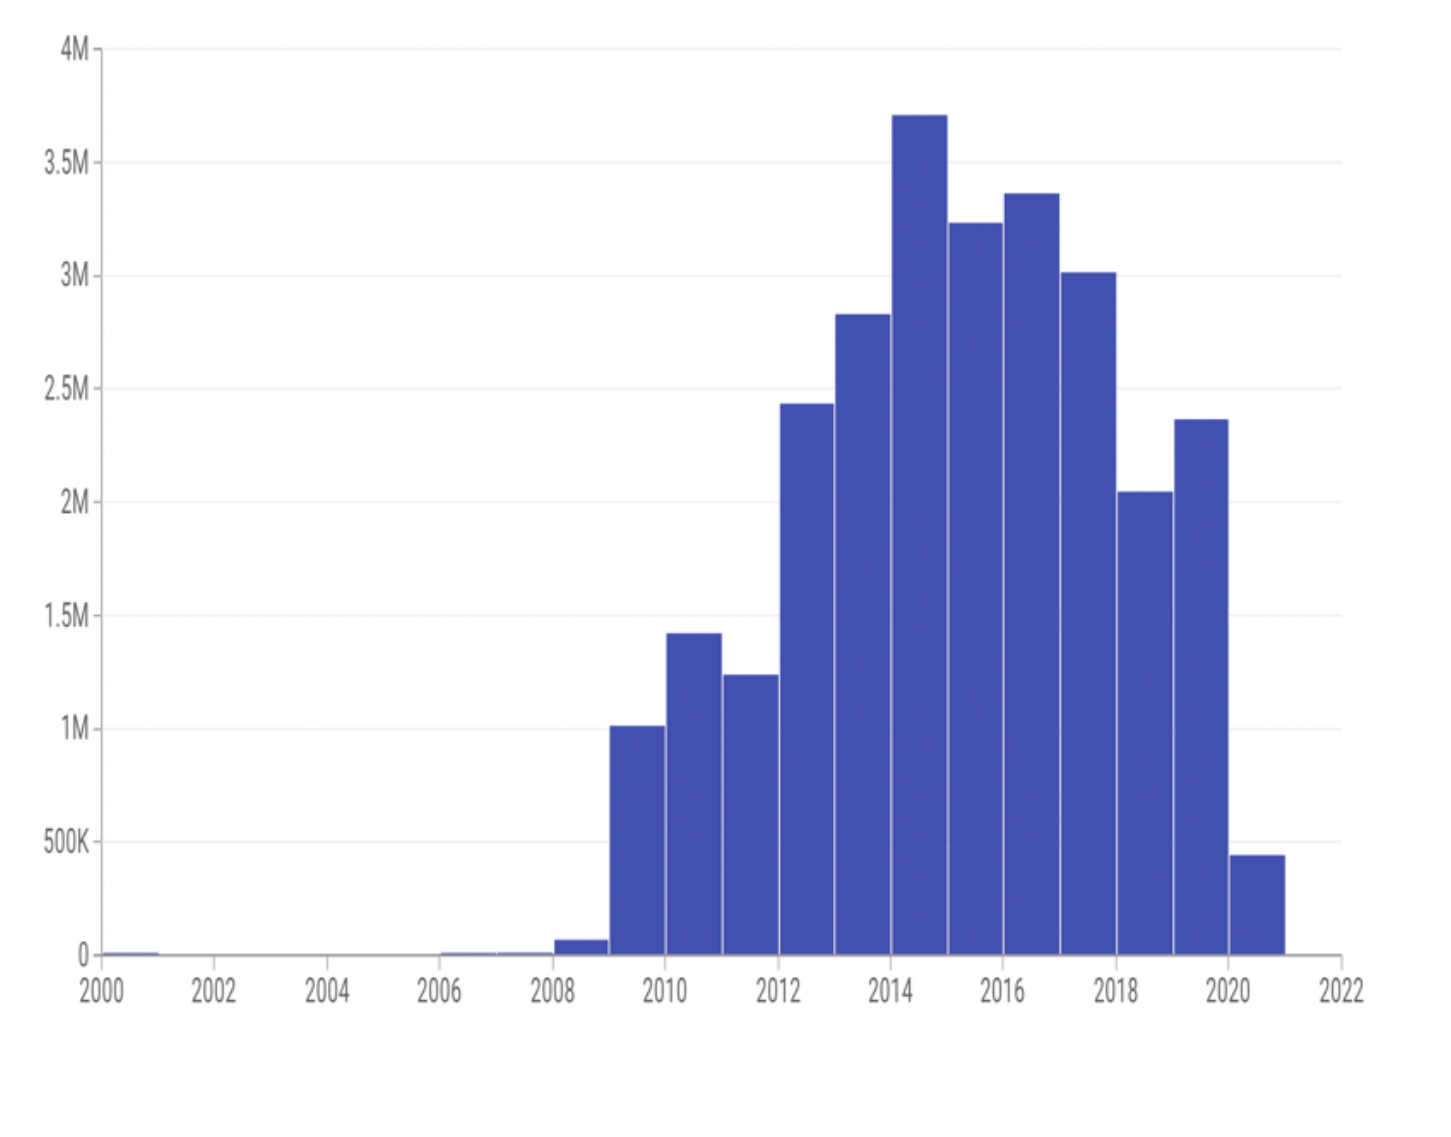
Variation in Volume of data/vehicle: After pre- processing, the main analysis of this traffic dataset shows the number of increases in the volume of cars from the year 2000 to 2020. (Queries being displayed in the implementation section on report published on Github)
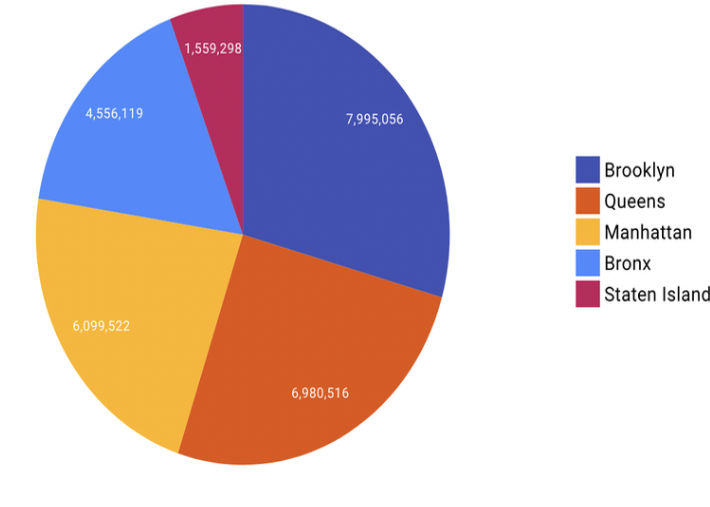
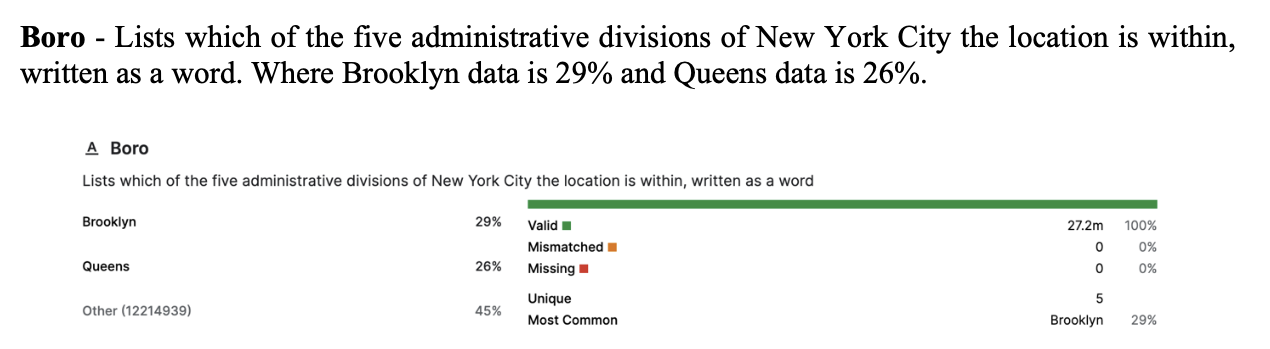
Busiest Cities of NYC: After pre-processing and running queries and we extracted the top 3 busiest cities and, it found that Brooklyn is the most crowded and busiest city with the count of vehicles (7,995,056, 29%), Queens being the 2nd busiest (6,980,516, 26%) and Manhattan being the 3rd busiest (6,099,052, 22%).